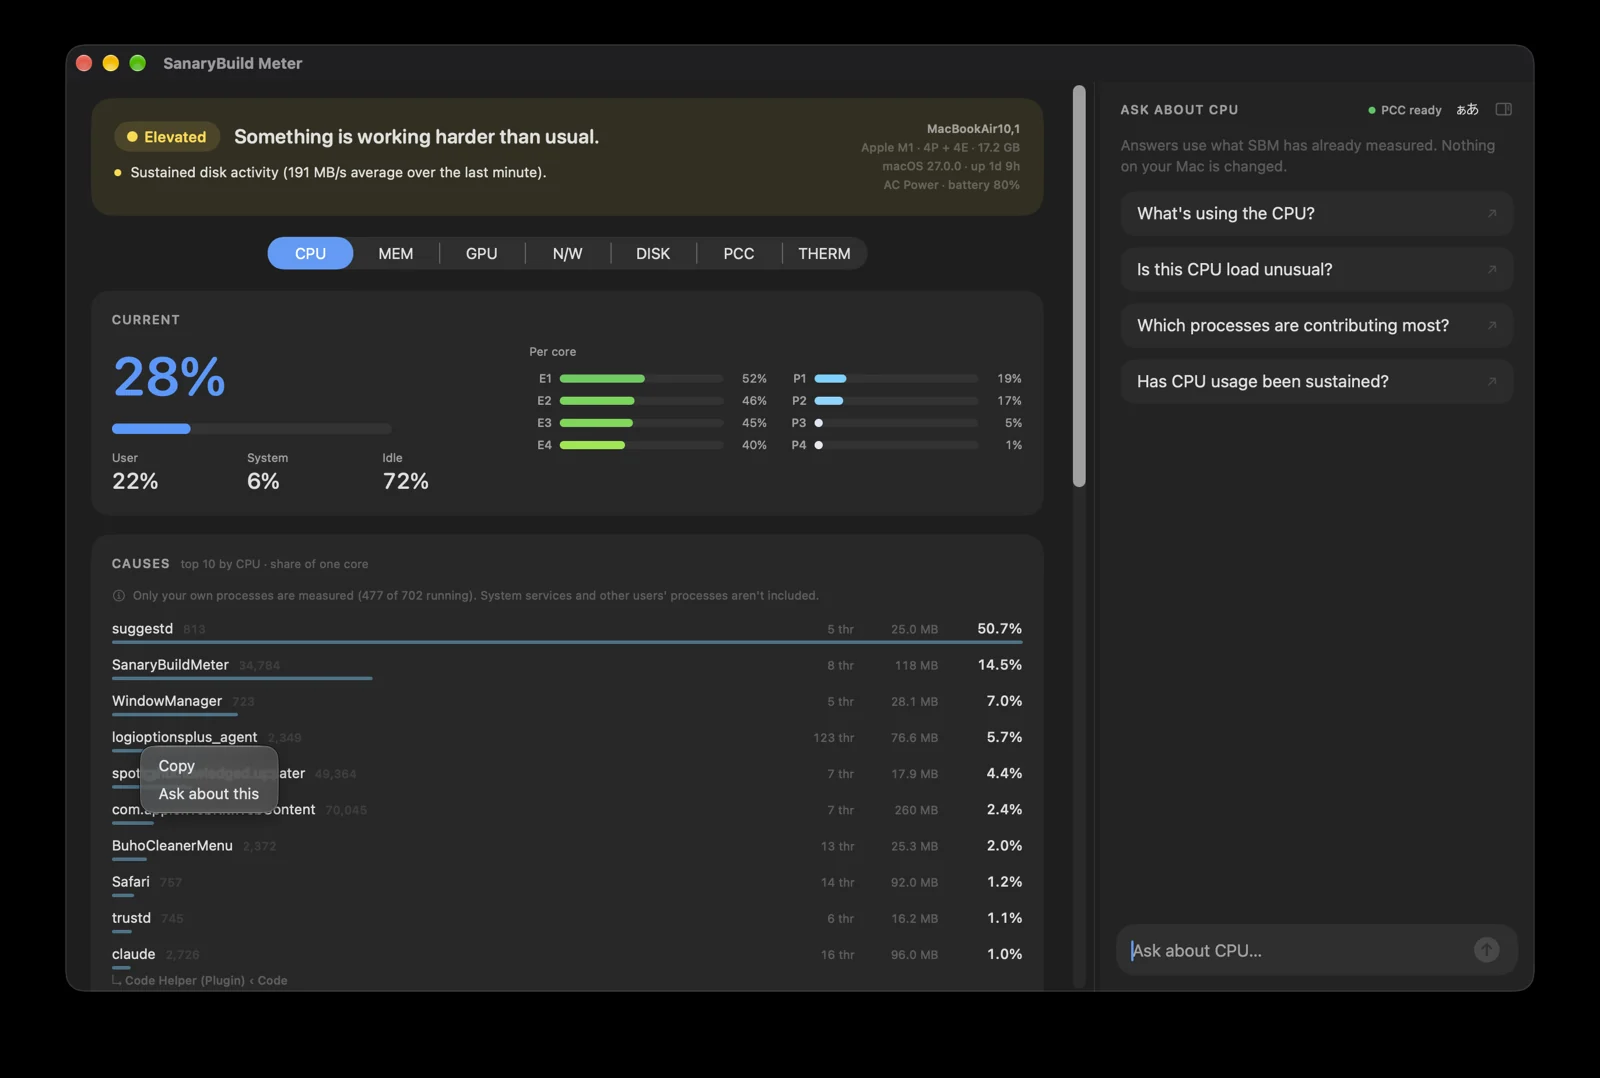
1. Start with the item you’re curious about.
For a question about Swap, start with what it is, why it exists, and what changes usually mean. Then, when useful, relate that explanation to your current readings.
 SanaryBuild MeterSBM · macOS System Monitor / System Health Utility
Your Mac’s activity, at a glance. A closer look when you need it. An explanation when you want one. A system monitor that helps you make sense of what you see.
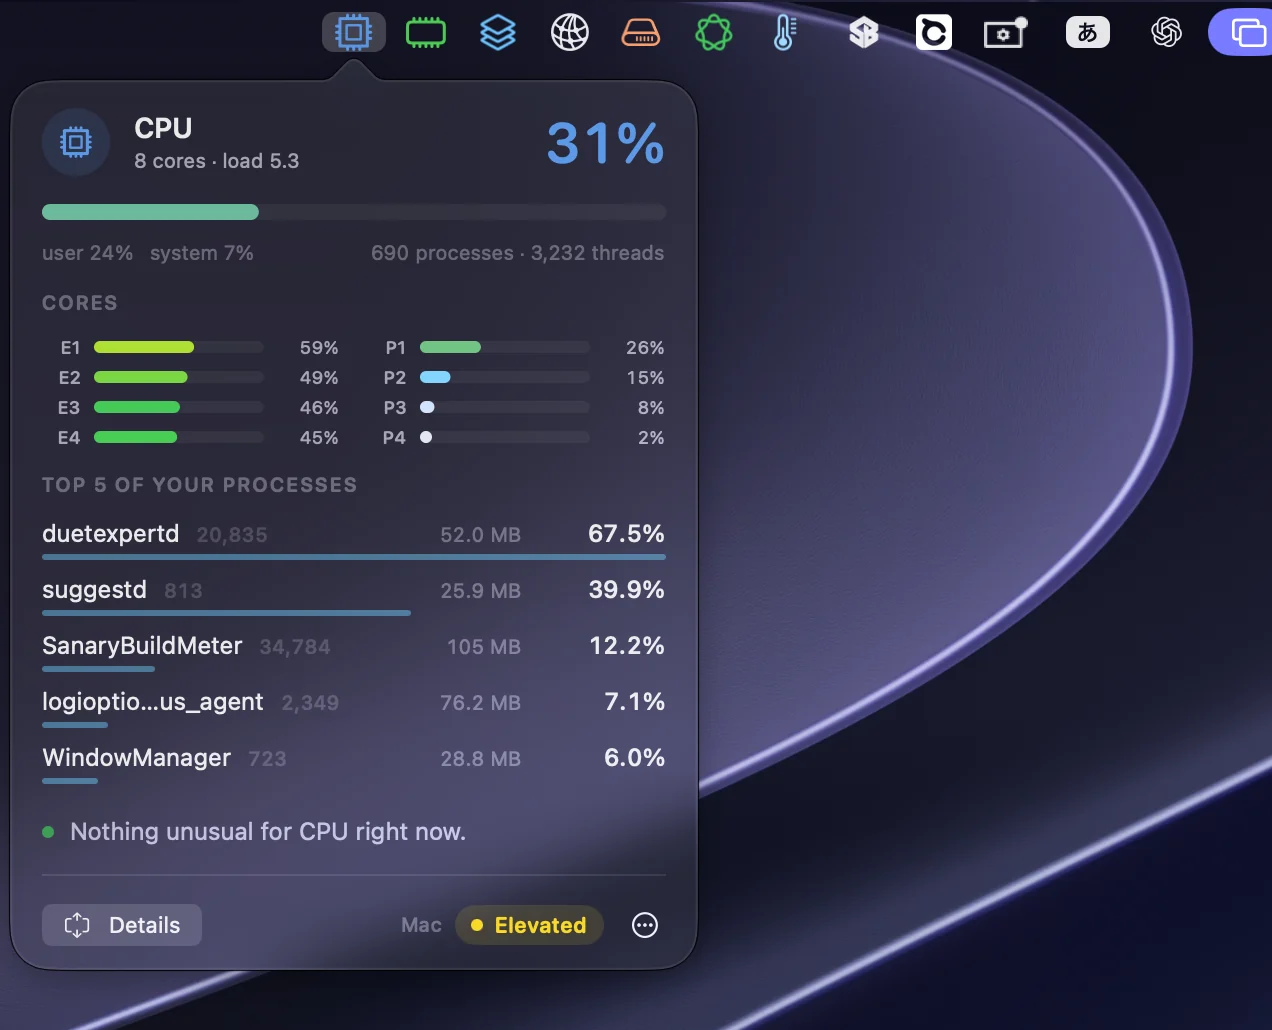
A quick look at your Mac, without leaving your flow.
01 / GLANCE
A busy moment or a persistent slowdown? The menu bar gives you a sense of your Mac’s activity through icons and color. Keep the numbers visible, or hide them for a quieter view.

02 / GLASS
You don’t always need a full dashboard. Click a meter to open Glass: current readings, useful context, and leading processes for that item. Click another meter to switch, without closing the view first.
Prefer to dismiss Glass by clicking outside it? You can choose that behavior in Settings.
03 / DETAIL
When you want to investigate, move from Glass into Detail. Start with the current state, look at contributing factors, follow changes over time, and explore deeper system information.
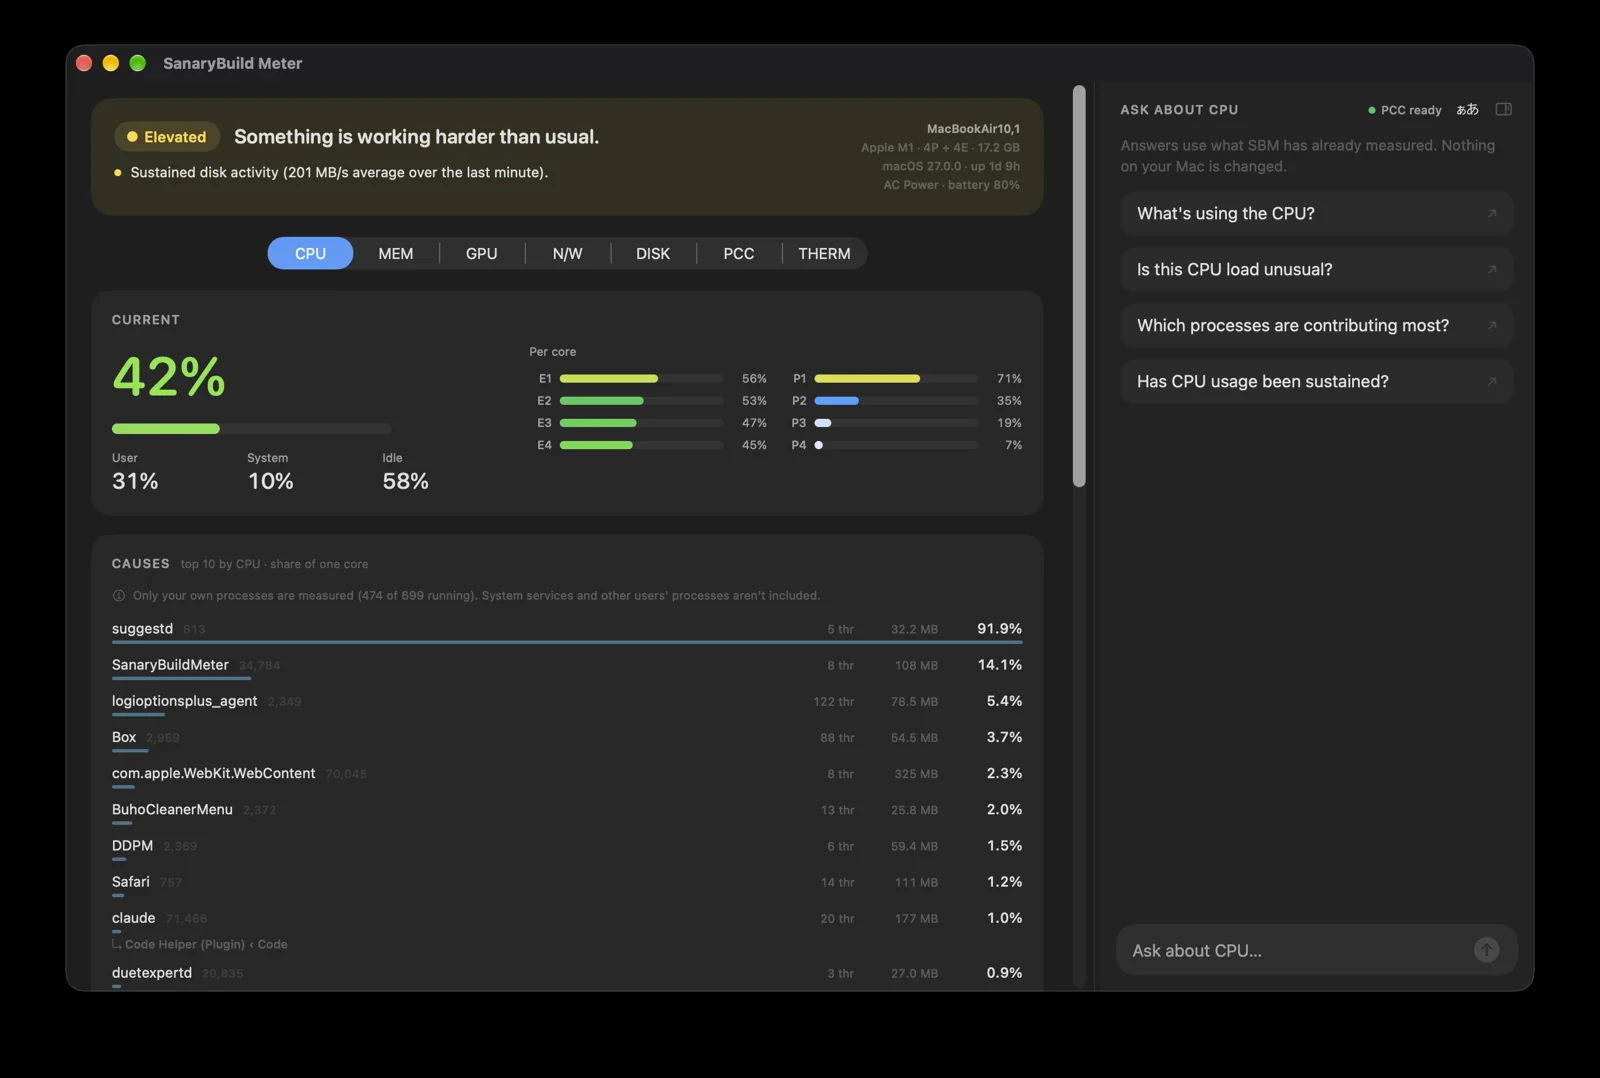
Explore CPU, Memory, GPU, Network, Disk, PCC, and Thermal. Power appears as supporting system information, rather than a separate menu bar meter.
HISTORY / SYSTEM HEALTH
Readings make more sense with context. Follow activity through History, then check System Health for an assessment based on observed data. SBM applies defined rules to determine health.
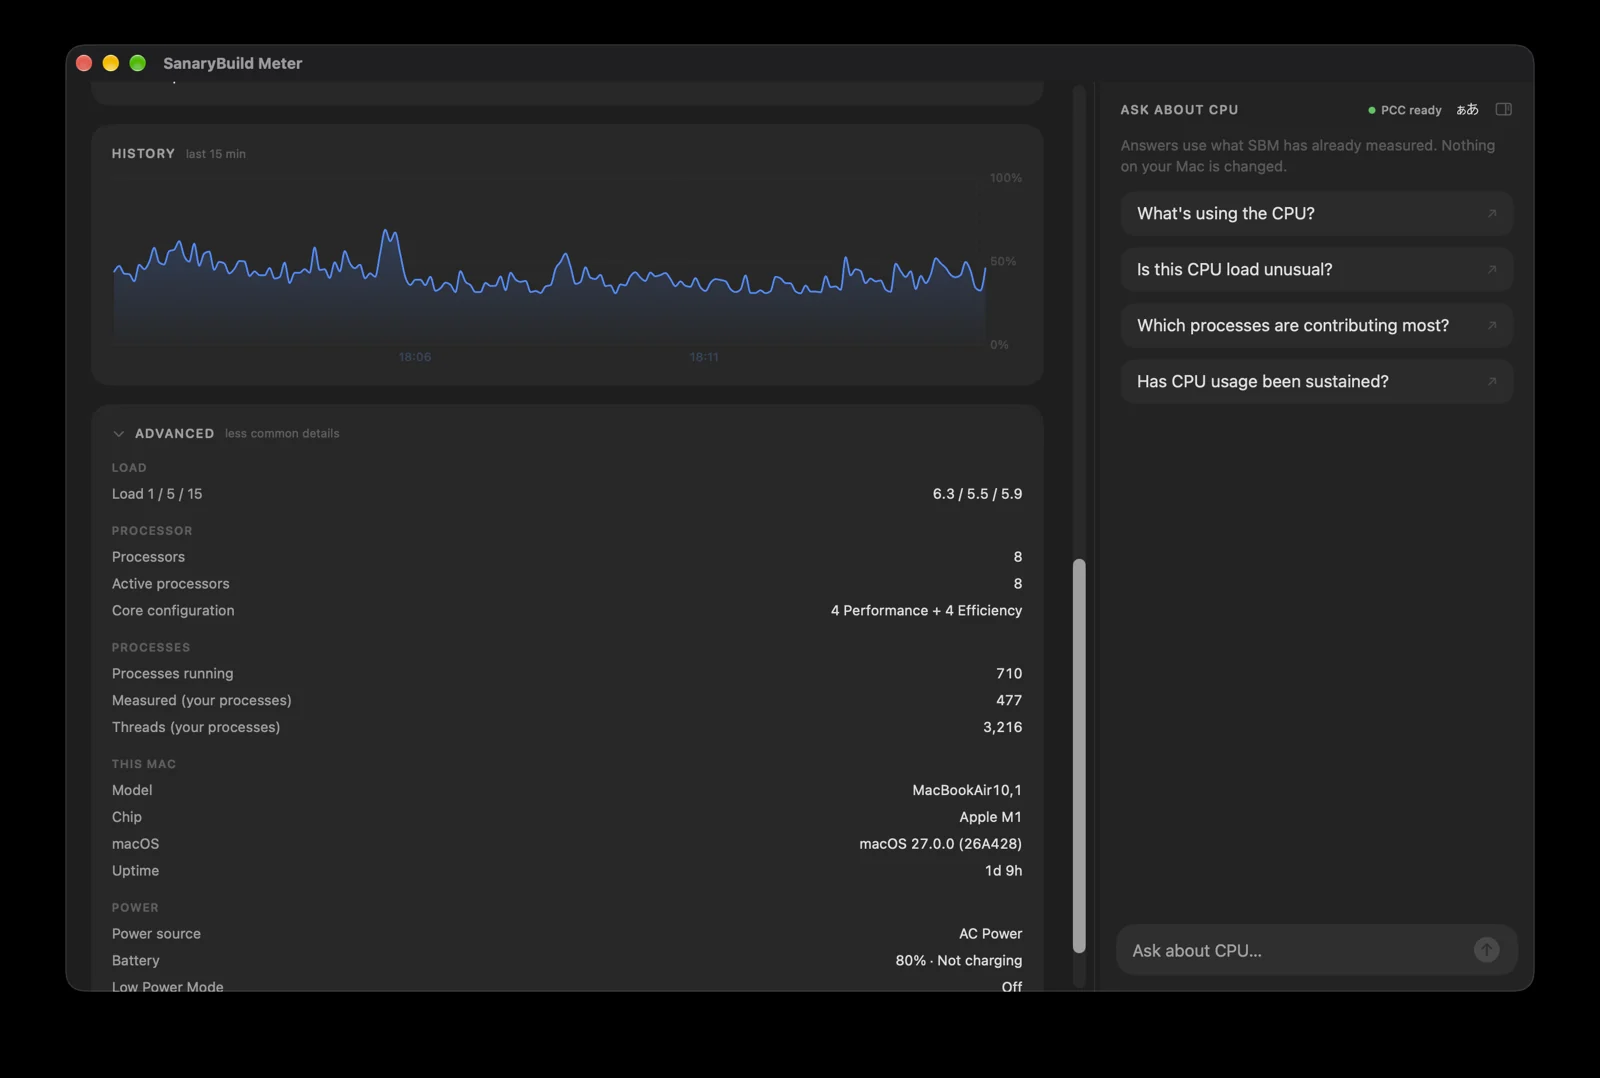
Health assessment is not delegated to AI. SBM handles measurement and deterministic health judgments; AI helps explain the information so you can decide what to do.
04 / ASK ABOUT THIS
Right-click a value, label, or process in Glass or the Dashboard and choose “Ask about this.” Your question starts with the item you’re looking at, without copying readings into a separate chat.
For a question about Swap, start with what it is, why it exists, and what changes usually mean. Then, when useful, relate that explanation to your current readings.
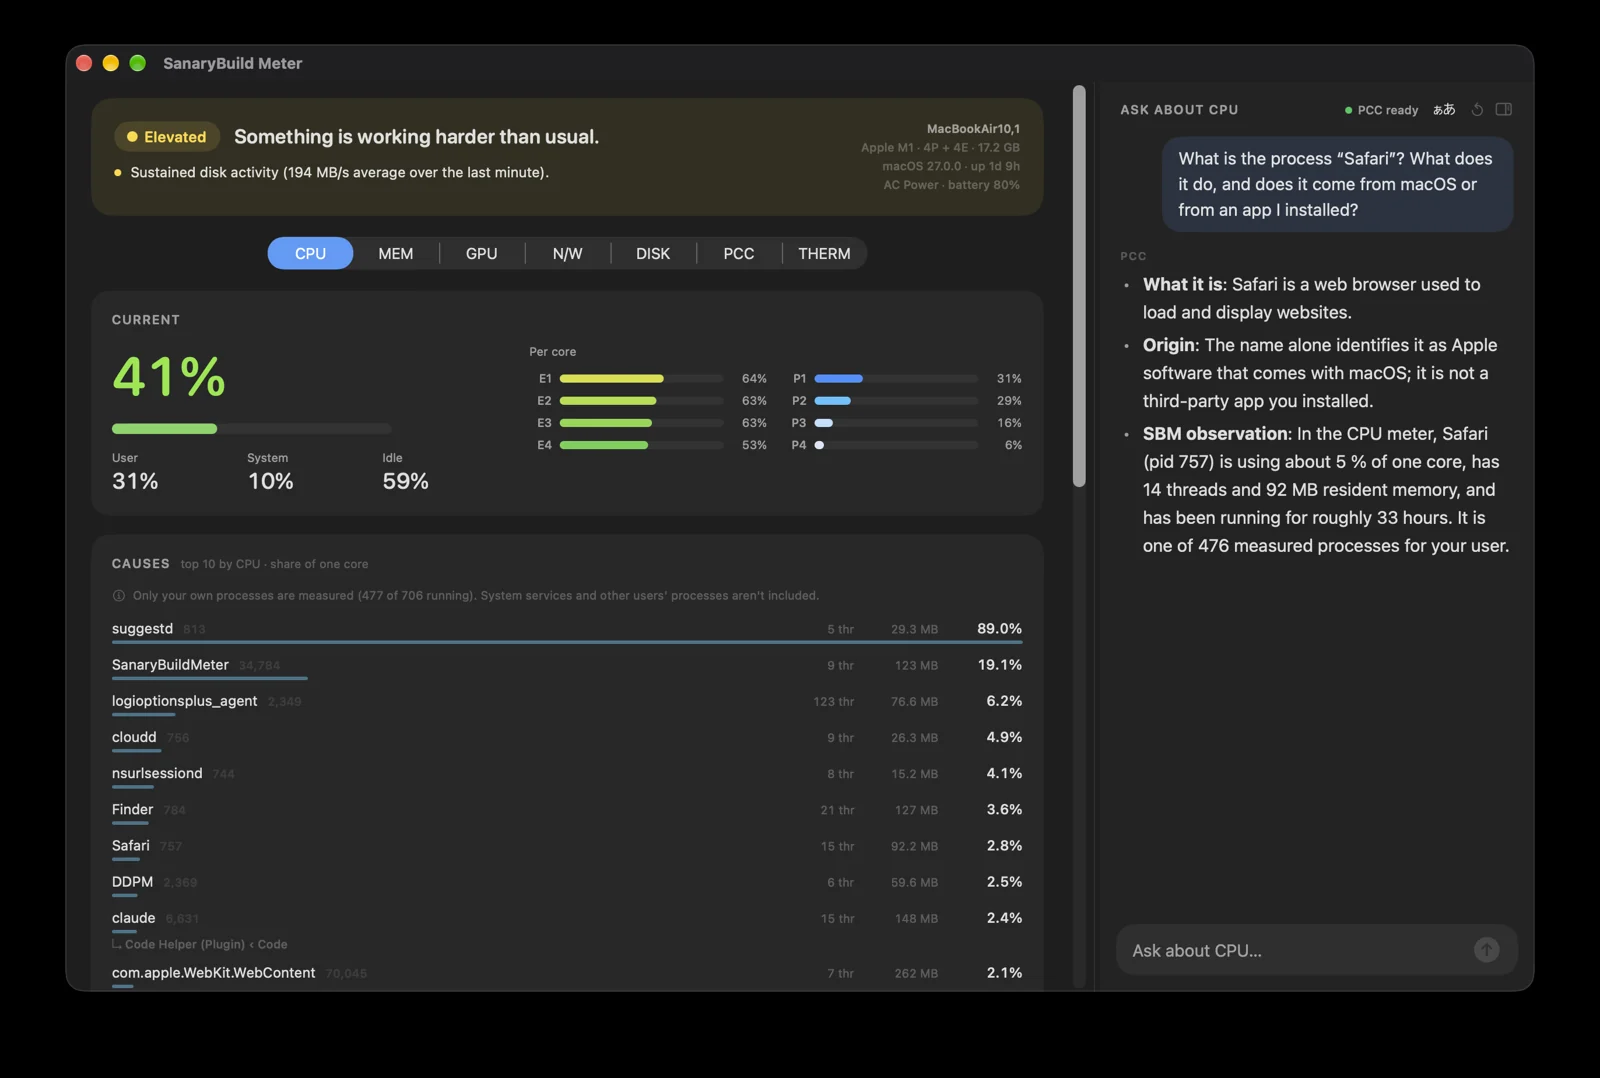
Get context, beyond a restatement of the numbers. Process explanations are designed to acknowledge what cannot be verified, rather than invent a purpose from a name.
When you ask, Apple’s Private Cloud Compute (PCC) uses the diagnostic context needed to explain what you’re seeing. Measurement and health judgments do not depend on AI. If PCC is unavailable, the app shows the reason.
ACTIVITY COLOR
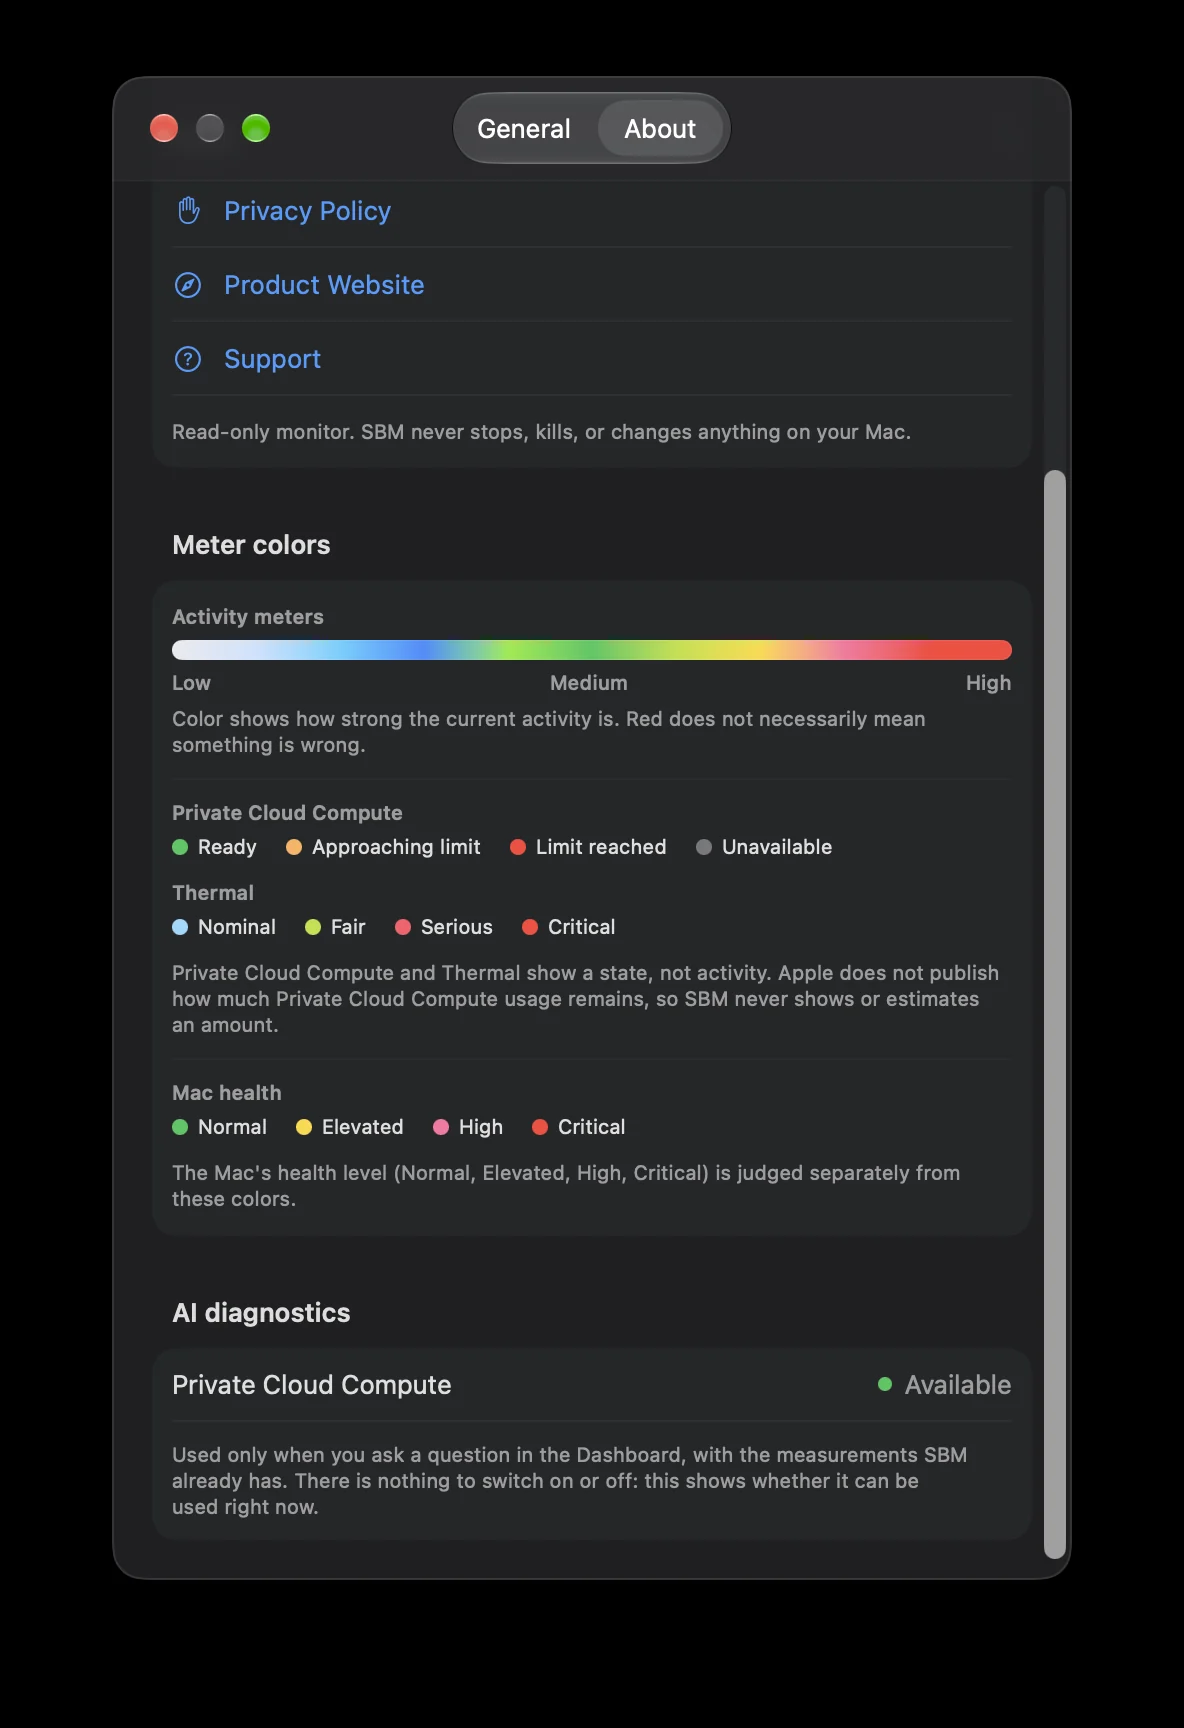
CPU isn’t assigned blue, nor Memory purple. Activity colors change continuously with how active a metric is, so you can get a sense of your Mac’s activity even with the numbers hidden.
Red does not necessarily mean something is wrong. Activity Color and health judgments are separate. PCC and Thermal status colors also carry meanings distinct from activity.
PRIVACY / READ-ONLY
SBM does not terminate processes, change Mac settings, or control fans. It gives you information to help you make your own decisions.
SBM maintains App Sandbox. Process information is limited to what can be measured for your own user; it does not have unrestricted access to every process on your Mac.
AI serves as an explanation layer, using relevant diagnostic information when you ask. System measurement and health assessment remain SBM’s responsibility.
SANARYBUILD METER
From a glance to a closer look. From a question to understanding. SanaryBuild Meter is being prepared for release.
Coming SoonThe App Store link will be available here after launch.